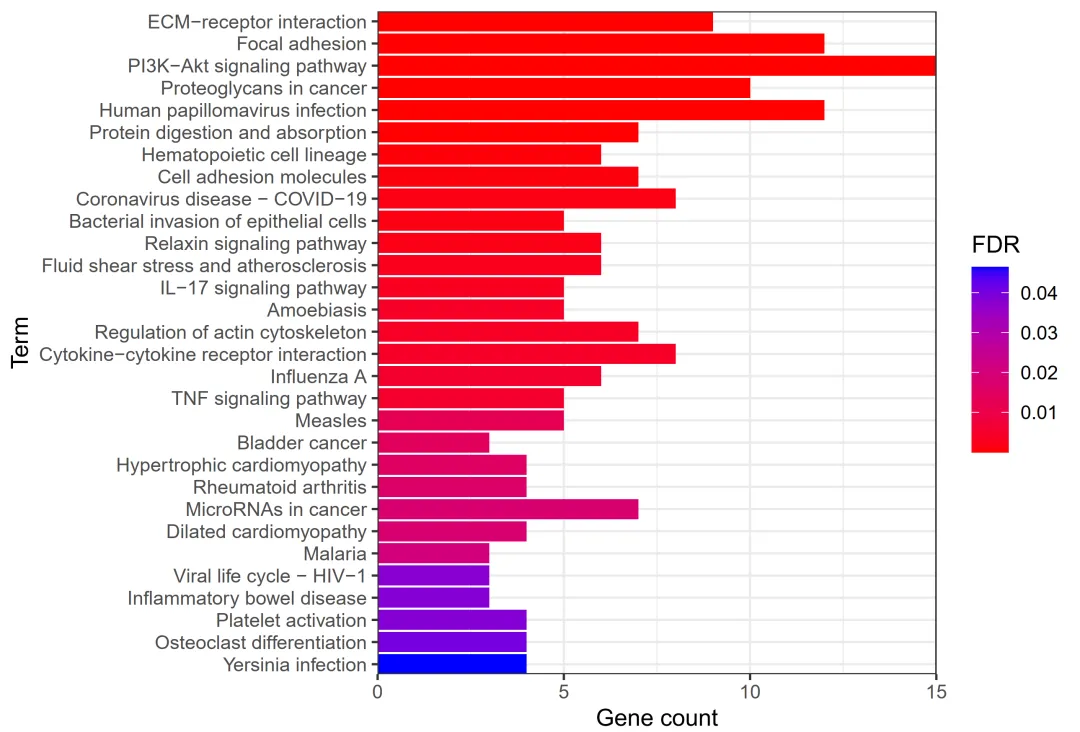
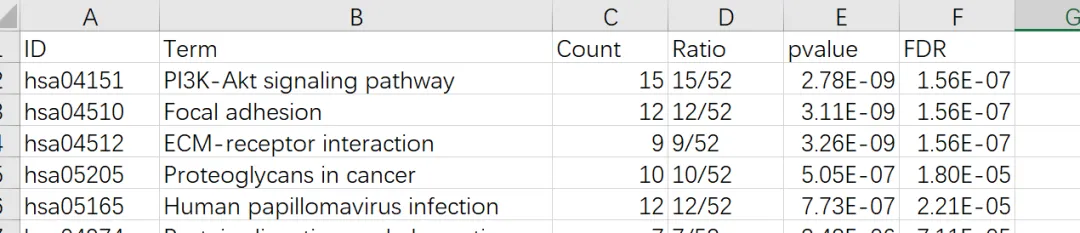
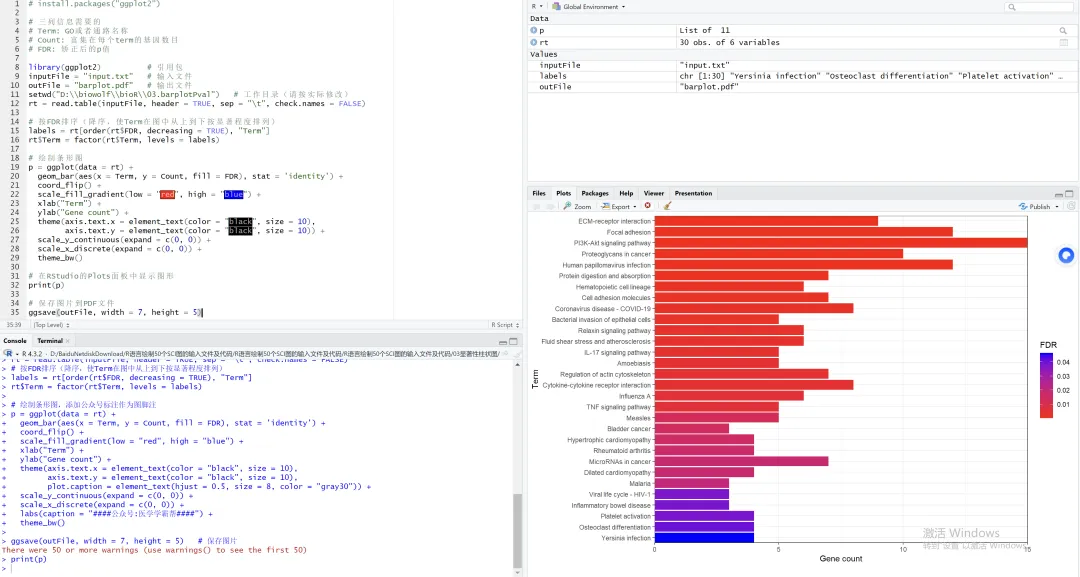
# install.packages("ggplot2")# 三列信息需要的# Term: GO或者通路名称# Count: 富集在每个term的基因数目# FDR: 矫正后的p值library(ggplot2) # 引用包inputFile = "input.txt" # 输入文件outFile = "barplot.pdf" # 输出文件setwd("你的工作路径") # 工作目录(请按实际修改)rt = read.table(inputFile, header = TRUE, sep = "\t", check.names = FALSE)# 按FDR排序(降序,使Term在图中从上到下按显著程度排列)labels = rt[order(rt$FDR, decreasing = TRUE), "Term"]rt$Term = factor(rt$Term, levels = labels)# 绘制条形图p = ggplot(data = rt) + geom_bar(aes(x = Term, y = Count, fill = FDR), stat = 'identity') + coord_flip() + scale_fill_gradient(low = "red", high = "blue") + xlab("Term") + ylab("Gene count") + theme(axis.text.x = element_text(color = "black", size = 10), axis.text.y = element_text(color = "black", size = 10)) + scale_y_continuous(expand = c(0, 0)) + scale_x_discrete(expand = c(0, 0)) + theme_bw()# 在RStudio的Plots面板中显示图形print(p)# 保存图片到PDF文件ggsave(outFile, width = 7, height = 5)