做科研汇报 PPT,最头疼的经常不是写内容,而是配图。
机制图画不清楚,流程图看起来很临时,单细胞结果想做一页解释图又怕像假数据,最后的总结页也很容易变成“文字堆叠”。
现在用 gpt-image-2 做科研 PPT 配图,最实用的方式不是让它直接生成整套幻灯片,而是把它当成“示意图初稿生成器”:先用提示词生成结构清楚的图,再放回 PPT 里校正文字、统一配色、补充真实数据。
下面整理了 5 类科研 PPT 最常用的图,每一类都给出中英双语提示词。主题仍以“高压氧相关肺损伤与外泌体干预”为例,你可以把疾病、细胞类型、干预方式和检测指标替换成自己的课题。
中文提示词适合自己理解和快速修改,但在图像生成时,英文提示词通常更稳定,尤其是这些表达:
- •
experimental workflow diagram - •
molecular mechanism schematic - •
single-cell transcriptomics concept diagram - •
therapeutic mechanism map - •
graphical summary figure - •
academic presentation style
科研图最怕两个问题:一是图看起来太卡通,二是文字和结构不够学术。英文提示词里把图的类型、布局、配色、标签和限制写清楚,生成结果会更接近 PPT 里真正能用的示意图。
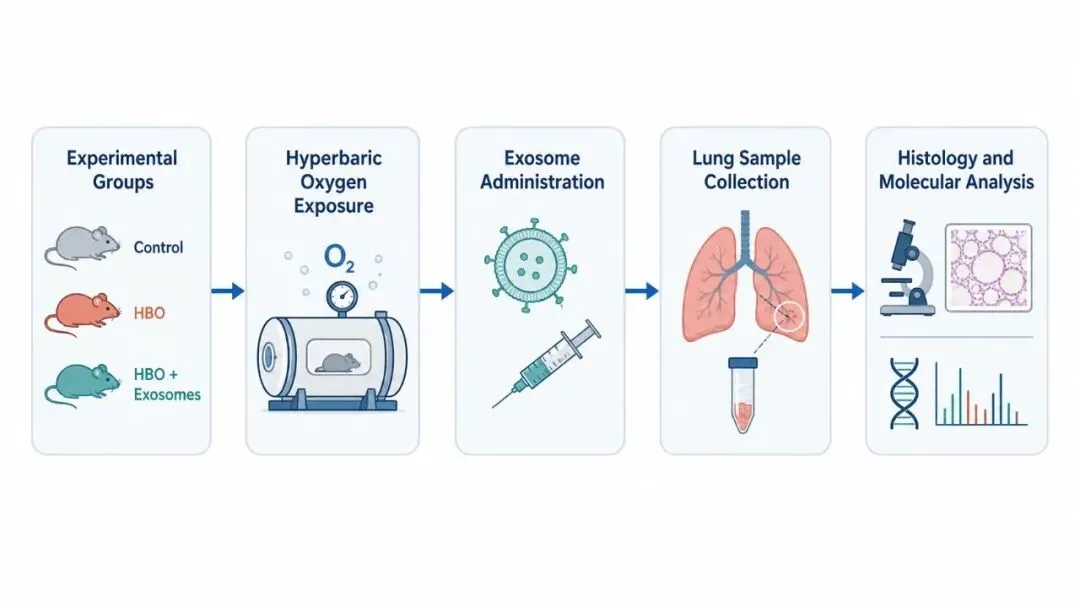
模板 1:研究流程图 / Experimental Workflow
适用场景:
这类图的重点是交代“分组、干预、取样、检测”四件事,而不是简单堆步骤。
中文提示词
生成一张科研 PPT 使用的横向研究流程图,16:9 比例,白色背景,扁平医学信息图风格。研究主题:高压氧暴露诱导肺损伤,以及外泌体干预的保护作用。流程从左到右分为 5 个节点:Experimental groups -> Hyperbaric oxygen exposure -> Exosome administration -> Lung sample collection -> Histology and molecular analysis。Experimental groups 节点包含 Control、HBO、HBO + Exosomes 三组。每个节点使用浅色圆角矩形和简洁医学图标表示,节点之间用细蓝色箭头连接。所有文字使用英文短标签,字体清晰,避免长句。配色为深蓝、青绿色、浅灰和少量橙红色强调损伤过程。整体风格干净、克制,适合学术汇报 PPT。不要生成真实数据、坐标轴、期刊 logo、复杂背景或装饰性元素。
English Prompt
Generate a horizontal experimental workflow diagram for an academic PPT, 16:9 landscape, white background, flat medical infographic style.Research topic: hyperbaric oxygen-induced lung injury and the protective effect of exosome intervention.Show five workflow nodes from left to right:Experimental groups -> Hyperbaric oxygen exposure -> Exosome administration -> Lung sample collection -> Histology and molecular analysis.In the Experimental groups node, include Control, HBO, and HBO + Exosomes.Represent each node with a pale rounded rectangle and a simple biomedical icon. Connect nodes with thin blue arrows.Use concise English labels only, with clear sans-serif typography.Color palette: navy blue, teal green, light gray, and subtle orange-red accents for injury-related steps.Keep the diagram clean, restrained, and suitable for an academic presentation.Do not include real data, axes, journal logos, complex backgrounds, or decorative elements.
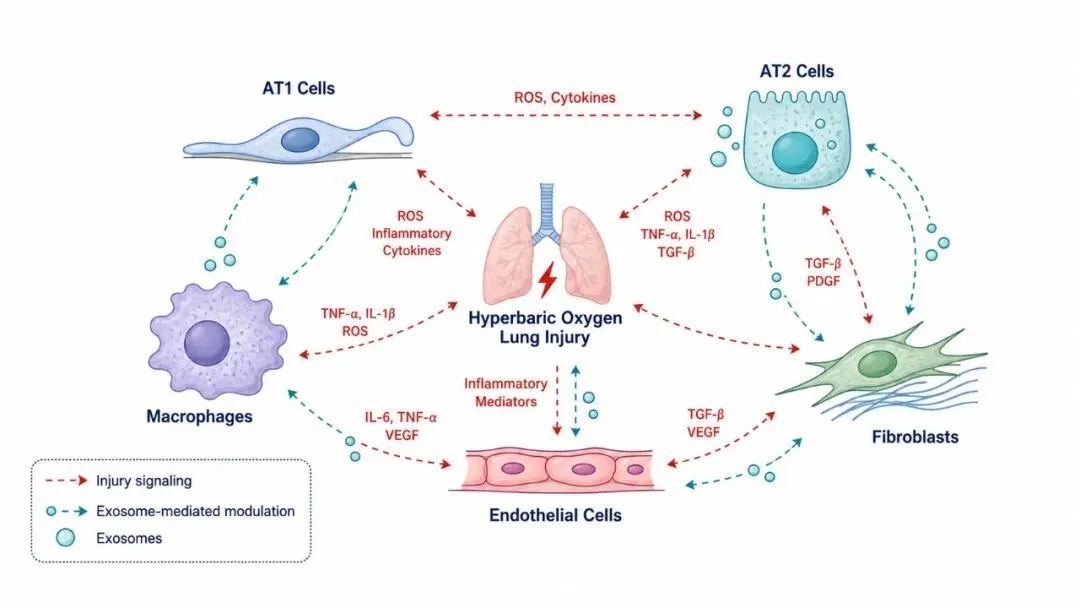
模板 2:机制示意图 / Mechanism Diagram
适用场景:
机制图不要一开始就画很多分子。更稳的做法是:先把组织结构、损伤方向和关键事件画清楚,再少量加入分子标签。
中文提示词
绘制一张肺泡-毛细血管屏障损伤机制示意图,16:9 横版,浅灰白背景,专业医学插画风格。主题:高压氧暴露导致肺泡上皮和毛细血管内皮发生氧化应激损伤。画面中心展示放大的肺泡-毛细血管界面:上方为 Alveolar epithelium;下方为 Capillary endothelium;中间显示 Basement membrane 和屏障结构。机制链条为:Excess oxygen -> ROS accumulation -> Mitochondrial dysfunction -> Barrier leakage -> Inflammatory infiltration。用红色发光小点表示 ROS,用橙红色箭头表示损伤推进,用蓝灰色表示正常组织结构。关键标签使用英文:ROS、Mitochondria、Barrier leakage、Inflammation。画面应像学术综述中的机制示意图,层次清楚,不要过度卡通化。不要加入真实显微图、统计图、过多分子名称、期刊水印或 logo。
English Prompt
Create an alveolar-capillary barrier injury mechanism diagram, 16:9 landscape, light gray-white background, professional medical illustration style.Topic: hyperbaric oxygen exposure induces oxidative stress injury in alveolar epithelial cells and capillary endothelial cells.Center the figure on a magnified alveolar-capillary interface:upper region: Alveolar epithelium;lower region: Capillary endothelium;middle region: Basement membrane and barrier structure.Show the mechanistic sequence:Excess oxygen -> ROS accumulation -> Mitochondrial dysfunction -> Barrier leakage -> Inflammatory infiltration.Use red glowing particles for ROS, orange-red arrows for injury progression, and blue-gray tones for normal tissue structures.Use concise English labels: ROS, Mitochondria, Barrier leakage, Inflammation.The figure should look like a mechanism schematic in an academic review article, clear and layered, not overly cartoonish.Do not include real microscopy images, statistical plots, excessive molecular names, journal watermarks, or logos.

模板 3:细胞亚群示意图 / Cell Subpopulation Diagram
适用场景:
注意:这类图适合做“单细胞结果解释图”,不要让 AI 生成假 UMAP 或假聚类结果。
中文提示词
生成一张单细胞转录组结果的概念解释图,16:9 横版,白色背景,扁平医学信息图风格。主题:高压氧肺损伤中肺组织细胞亚群和细胞通讯变化。画面展示一个简化的肺组织微环境,包含 5 类细胞:AT1 cells、AT2 cells、Macrophages、Endothelial cells、Fibroblasts。用不同颜色和形状表示不同细胞类型,但不要画成真实 UMAP。用虚线箭头表示细胞间通讯。用红色小标签表示 injury signaling,用青绿色箭头表示 exosome-mediated modulation。所有标签使用英文短词,画面留白充足,适合放在单细胞结果页前作为概念导入。不要出现坐标轴、聚类编号、假数据点、数值图例或真实统计结果。
English Prompt
Generate a conceptual explanation diagram for single-cell transcriptomics results, 16:9 landscape, white background, flat medical infographic style.Topic: changes in lung cell subpopulations and cell-cell communication during hyperbaric oxygen-induced lung injury.Show a simplified lung tissue microenvironment with five cell types:AT1 cells, AT2 cells, Macrophages, Endothelial cells, and Fibroblasts.Use different colors and shapes for different cell types, but do not make it look like a real UMAP.Use dashed arrows to represent cell-cell communication.Use small red labels for injury signaling and teal arrows for exosome-mediated modulation.Use concise English labels only. Keep enough white space and make it suitable as a conceptual introduction before real single-cell result slides.Do not include axes, cluster numbers, fake data points, numeric legends, or real statistical results.
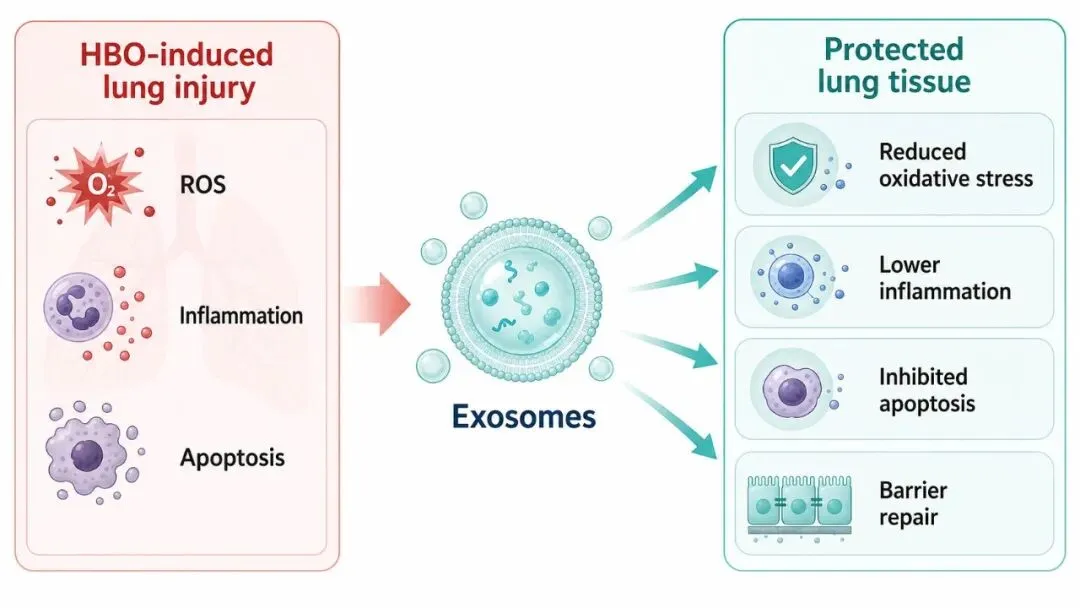
模板 4:干预机制图 / Therapeutic Mechanism
适用场景:
治疗机制图最好突出“干预对象”和“保护方向”,少放无法验证的机制。
中文提示词
绘制一张外泌体干预机制概念图,16:9 横版,白色背景,扁平医学插画风格。画面中心为 Exosomes,用半透明蓝绿色囊泡表示。Exosomes 向右作用于受损肺泡-毛细血管屏障,展示 4 个保护方向:Reduced oxidative stress、Lower inflammation、Inhibited apoptosis、Barrier repair。左侧用浅红色区域表示 HBO-induced lung injury,包括 ROS、Inflammation、Apoptosis 三个损伤标签。右侧用浅青绿色区域表示 protected lung tissue。使用清晰箭头连接 Exosomes 和保护机制。整体配色为蓝绿色、浅灰、白色和少量红色;风格适合科研 PPT 结论或讨论页。不要生成夸张 3D 效果、过多装饰、真实数据图或长段文字。
English Prompt
Draw a therapeutic mechanism concept diagram for exosome intervention, 16:9 landscape, white background, flat medical illustration style.Place Exosomes at the center, represented as translucent blue-green vesicles.Show Exosomes acting on the injured alveolar-capillary barrier and leading to four protective effects:Reduced oxidative stress, Lower inflammation, Inhibited apoptosis, and Barrier repair.On the left, use a pale red region for HBO-induced lung injury, with three injury labels: ROS, Inflammation, Apoptosis.On the right, use a pale teal region for protected lung tissue.Use clear arrows connecting Exosomes to the protective mechanisms.Color palette: blue-green, light gray, white, and subtle red accents. Suitable for a scientific PPT conclusion or discussion slide.Do not include exaggerated 3D effects, excessive decoration, real data plots, or long paragraphs of text.
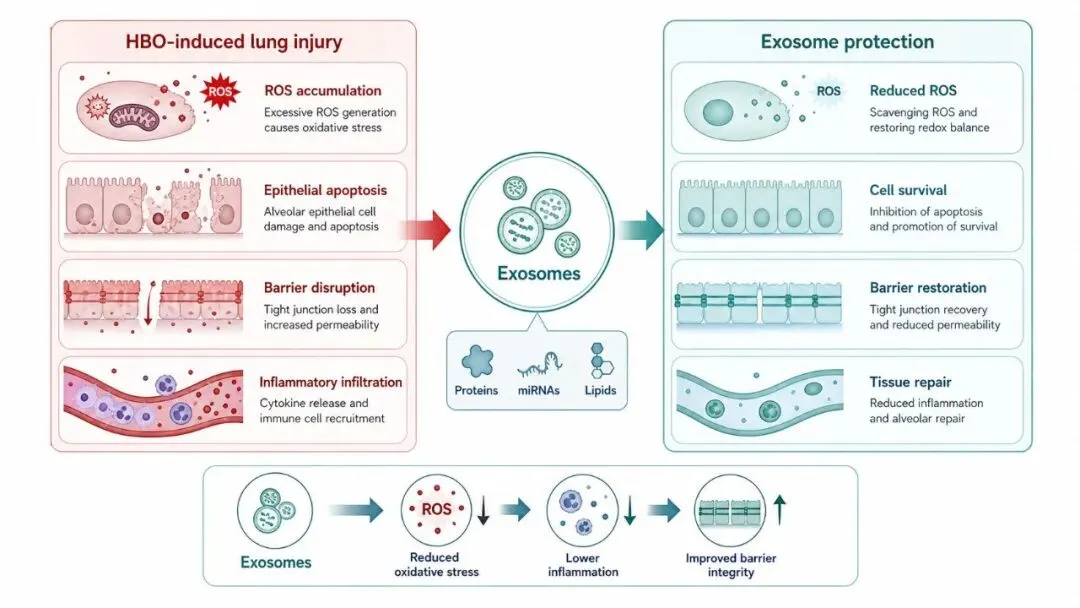
模板 5:结论总结图 / Summary Figure
适用场景:
总结图的任务不是重复所有结果,而是把“损伤状态”和“干预后改善”放在同一张图里,让听众记住核心结论。
中文提示词
生成一张科研汇报结论总结图,16:9 横版,白色背景,医学 graphical abstract 风格。整体采用左右对比结构。左侧标题为 HBO-induced lung injury,使用浅红色背景,展示:ROS accumulation、epithelial apoptosis、barrier disruption、inflammatory infiltration。右侧标题为 Exosome protection,使用浅青绿色背景,展示:reduced ROS、cell survival、barrier restoration、tissue repair。中间放置 Exosomes 作为干预节点,用箭头从左侧病理状态指向右侧保护状态。底部添加简短机制链:Exosomes -> reduced oxidative stress -> lower inflammation -> improved barrier integrity。整体风格严谨、简洁、适合学术汇报最后一页。不要加入真实数据、复杂背景、长段文字、期刊 logo 或水印。
English Prompt
Generate a scientific summary figure for an academic presentation, 16:9 landscape, white background, medical graphical abstract style.Use a left-right comparison layout.Left title: HBO-induced lung injury, with a pale red background showing:ROS accumulation, epithelial apoptosis, barrier disruption, and inflammatory infiltration.Right title: Exosome protection, with a pale teal background showing:reduced ROS, cell survival, barrier restoration, and tissue repair.Place Exosomes as the intervention node in the center, with arrows moving from the pathological state on the left to the protective state on the right.Add a concise mechanism chain at the bottom:Exosomes -> reduced oxidative stress -> lower inflammation -> improved barrier integrity.Keep the figure rigorous, clean, and suitable for the final slide of an academic presentation.Do not include real data, complex backgrounds, long paragraphs, journal logos, or watermarks.
3 个让图片更好用的小技巧
1. 先生成“少文字版”
AI 图里的文字越多,越容易出现错字、挤压和排版问题。
如果生成效果不稳定,可以追加:
Keep only short English labels. Remove long text and paragraphs.
长解释放在 PPT 文本框里手动写,整体会更稳。
2. 统一整套 PPT 的颜色语义
同一套汇报里,建议固定颜色:
每次生成图时,都可以在提示词最后加一句:
Use a consistent academic medical color palette: red for injury, teal for protection, blue-gray for normal structures, and white background.
3. 不满意就做局部迭代
第一版只看结构,不要急着追求完美。结构对了以后,再追加修改:
Make the diagram more suitable for an academic conference presentation.
Reduce decorative elements and keep the layout cleaner.
Make arrows thinner and labels more readable.
Remove fake charts, axes, numeric legends, and real-data-like elements.
2-3 轮以后,通常就能得到一张适合放进 PPT 的示意图。
最后还是那句话:gpt-image-2 很适合生成科研示意图,但不能替代真实实验结果。机制图、流程图、总结图可以交给 AI 起草;病理图、统计图、组学图,必须来自真实数据。