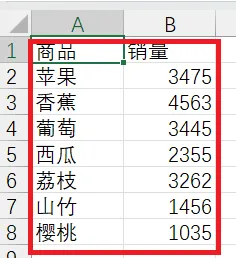
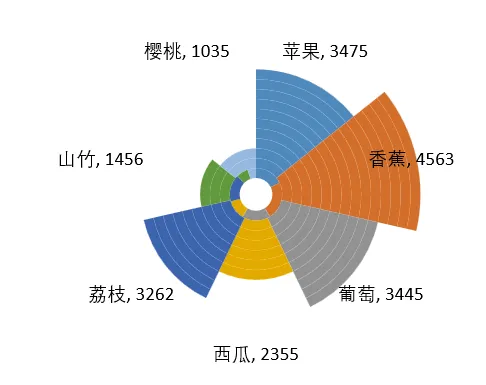
Private Sub CommandButton1_Click() Dim i, j, F Dim p, pmax Dim ws As Worksheet Dim chartObj As ChartObject Dim mychart As Chart ' 初始化设置 Set ws = ActiveSheet '当前工作表 Set dataRange = ws.Range("A1").CurrentRegion ' A列为分类标签,B列为数值 Set chartObj = ws.ChartObjects.Add(Left:=100, Width:=375, Top:=75, Height:=225) Set mychart = chartObj.Chart mychart.chartType = xlDoughnut mychart.SetSourceData Source:=dataRange mychart.ChartGroups(1).DoughnutHoleSize = 10 With mychart.FullSeriesCollection(1) .ApplyDataLabels .DataLabels.ShowPercentage = True .Format.Line.Weight = 0 F = "={1" For i = 2 To .DataLabels.Count F = F & ",1" Next F = F & "}" For i = 2 To 15 mychart.SeriesCollection.NewSeries mychart.FullSeriesCollection(i).Values = F Next i For i = 1 To .DataLabels.Count p = Val(.DataLabels(i).Text) If pmax < p Then pmax = p Next i For i = 1 To .DataLabels.Count p = Val(.DataLabels(i).Text) For j = 1 To 15 mychart.FullSeriesCollection(i).Format.Line.Weight = 0 mychart.SeriesCollection(j).Points(i).Select If j > p * 15 / pmax Then mychart.SeriesCollection(j).Points(i).Format.Fill.Visible = msoFalse End If Next j Next i '设置数据标签 .DataLabels.ShowValue = True .DataLabels.ShowPercentage = False .DataLabels.ShowCategoryName = True ActiveChart.SeriesCollection(15).ApplyDataLabels For i = 1 To .DataLabels.Count mychart.SeriesCollection(15).DataLabels(i).Text = .DataLabels(i).Text Next i .DataLabels.Delete mychart.Legend.Delete End WithEnd Sub