“将枯燥的数据条形图,转化为由重复的小图标(如水果)堆叠而成的可视化图表,使数据对比更加生动形象”总是听到或看到有人问,编程好学吗?如何入门?多久能学会?它能做些什么?怎么写代码呀?执行过程中出问题了谁能帮帮我...如果你也有类似的问题那就赶快关注我的公众号,一起学起来吧!
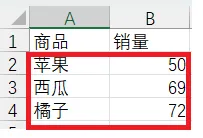
Excel提供的传统图表(如柱状图、条形图)在结构上往往千篇一律,缺乏灵活性和视觉层次感,并且单一的色系也会干扰信息的传递,难以区分数据系列或聚焦核心指标目前,大家对图表的要求已经从“能看”升级到了“好看且易懂”,标准高了,这些传统的图表就越来越不能满足需求了接下来就分享一种实现方式,既要图表“能看”,还能兼顾“好看”且“易懂”假如我们已经在一张Excel表格中统计好了水果的销售数据。表格有两列:
现在,希望利用这两列数据,自动生成一个条形图。这个图表需要能直观地对比出不同水果的销量高低,让人一眼就能看出哪种水果卖得最好,哪种卖得最少
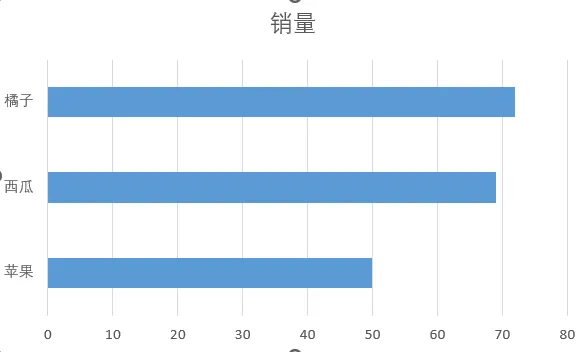
这是一个非常简单的图表需求,只需要使用Excel现有的图表模版就能实现。选中A与B列数据插入一张条形图,但这并不美观也不能让我们快速聚焦核心指标数据
我们换个更直观的玩法:把图中这三根冷冰冰的蓝柱子,直接变成它们代表的水果图片。销量是多少,就堆多少个对应的小水果图标。比如苹果卖了50份,下面就整整齐齐码上50个小苹果。这样一眼扫过去,就像看销量排行榜,谁多谁少,是不是特别明显?
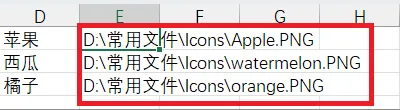
执行前的准备工作:
以上准备工作完成后,开始编码实现,其核心逻辑是通过读取数据并计算,在图表区域精确地按比例摆放多个小图标,从而直观地展示不同类别的数值大小,参考代码如下:
Sub HorizontalBarChartByIcons() Dim ws As Worksheet Dim chartObj As ChartObject Dim dataRange As Range Dim iconPath As String Dim maxValue As Double Dim iconWidth As Double, iconHeight As Double Dim i As Integer, j As Integer Dim shp As Shape Dim dataValues() As Double Dim categoryLabels() As String Dim categoryCount As Integer ' 初始化设置 Set ws = ThisWorkbook.Worksheets("Sheet5") '改为对应的工作表 Set dataRange = ws.Range("A1").CurrentRegion ' A列为分类标签,B列为数值 iconWidth = 20 ' 图标宽度(磅) iconHeight = 20 ' 图标高度(磅) ' 创建基础横向条形图 Set chartObj = ws.ChartObjects.Add(Left:=100, Width:=375, Top:=50, Height:=225) chartObj.Name = "IconStackedBarChart" ' 读取数据并计算最大值 categoryCount = dataRange.Rows.Count ReDim dataValues(1 To categoryCount) ReDim categoryLabels(1 To categoryCount) maxValue = 0 For i = 2 To categoryCount categoryLabels(i) = dataRange.Cells(i, 1).Value dataValues(i) = dataRange.Cells(i, 2).Value If dataValues(i) > maxValue Then maxValue = dataValues(i) Next i ' 计算图表绘图区位置和大小 Dim plotLeft As Double, plotTop As Double Dim plotWidth As Double, plotHeight As Double With chartObj.Chart.PlotArea plotLeft = chartObj.Left + .Left plotTop = chartObj.Top + .Top plotWidth = .Width plotHeight = .Height End With ' 创建小图标堆叠(核心部分) Dim categorySpacing As Double Dim barHeight As Double Dim startLeft As Double ' 计算每个分类的间距和条形高度 categorySpacing = plotWidth / (categoryCount + 1) barHeight = plotHeight / categoryCount * 0.6 ' 条形高度占分类高度的60% For i = 1 To categoryCount ' 计算当前分类条形起始位置 startLeft = plotLeft + categorySpacing ' 计算当前分类的图标数量(按比例缩放) Dim iconCount As Integer iconCount = Int(dataValues(i) / maxValue * (plotWidth - categorySpacing * 2) / iconWidth) If iconCount > 0 Then ' 计算条形垂直居中位置 Dim barTop As Double barTop = plotTop + (plotHeight / categoryCount) * (i - 0.5) - barHeight / 2 ' 创建图标堆叠 For j = 1 To iconCount Dim iconLeft As Double iconLeft = startLeft + (j - 1) * iconWidth iconPath = ws.Cells(i - 1, "E").Value 'E列获取小图标路径 ' 添加小图标形状 Set shp = ws.Shapes.AddPicture( _ Filename:=iconPath, _ LinkToFile:=msoFalse, _ SaveWithDocument:=msoTrue, _ Left:=iconLeft, _ Top:=barTop, _ Width:=iconWidth, _ Height:=iconHeight) shp.Name = "Icon_" & i & "_" & j Next j ' 添加数值标签 Set shp = ws.Shapes.AddTextbox(msoTextOrientationHorizontal, _ startLeft + iconCount * iconWidth + 5, _ barTop + iconHeight / 2 - 8, _ 30, 16) shp.Name = "ValueLabel_" & i shp.TextFrame.Characters.Text = Format(dataValues(i), "0") '显示格式:整数 shp.TextFrame.HorizontalAlignment = xlHAlignLeft '对齐方式 shp.TextFrame.VerticalAlignment = xlVAlignCenter shp.TextFrame.Characters.Font.Size = 12 shp.Fill.Visible = msoFalse '背景色及边框透明 shp.Line.Visible = msoFalse End If Next i MsgBox "条形图创建完成!", vbInformationEnd Sub